Formula interface to geom_density_2d() and geom_density_2d_filled()
Source:R/gf_functions.R
gf_density_2d.RdPerform a 2D kernel density estimation using MASS::kde2d() and
display the results with contours. This can be useful for dealing with
overplotting. This is a 2D version of geom_density(). geom_density_2d()
draws contour lines, and geom_density_2d_filled() draws filled contour
bands.
gf_density_2d(
  object = NULL,
  gformula = NULL,
  data = NULL,
  ...,
  alpha,
  color,
  group,
  linetype,
  linewidth,
  contour = TRUE,
  n = 100,
  h = NULL,
  lineend = "butt",
  linejoin = "round",
  linemitre = 1,
  xlab,
  ylab,
  title,
  subtitle,
  caption,
  geom = "density_2d",
  stat = "density_2d",
  position = "identity",
  show.legend = NA,
  show.help = NULL,
  inherit = TRUE,
  environment = parent.frame()
)

gf_density_2d_filled(
  object = NULL,
  gformula = NULL,
  data = NULL,
  ...,
  alpha,
  color,
  group,
  linetype,
  linewidth,
  contour = TRUE,
  n = 100,
  h = NULL,
  lineend = "butt",
  linejoin = "round",
  linemitre = 1,
  xlab,
  ylab,
  title,
  subtitle,
  caption,
  geom = "density_2d_filled",
  stat = "density_2d_filled",
  position = "identity",
  show.legend = NA,
  show.help = NULL,
  inherit = TRUE,
  environment = parent.frame()
)

gf_density2d(
  object = NULL,
  gformula = NULL,
  data = NULL,
  ...,
  alpha,
  color,
  group,
  linetype,
  linewidth,
  contour = TRUE,
  n = 100,
  h = NULL,
  lineend = "butt",
  linejoin = "round",
  linemitre = 1,
  xlab,
  ylab,
  title,
  subtitle,
  caption,
  geom = "density2d",
  stat = "density2d",
  position = "identity",
  show.legend = NA,
  show.help = NULL,
  inherit = TRUE,
  environment = parent.frame()
)

gf_density2d_filled(
  object = NULL,
  gformula = NULL,
  data = NULL,
  ...,
  alpha,
  color,
  group,
  linetype,
  linewidth,
  contour = TRUE,
  n = 100,
  h = NULL,
  lineend = "butt",
  linejoin = "round",
  linemitre = 1,
  xlab,
  ylab,
  title,
  subtitle,
  caption,
  geom = "density2d_filled",
  stat = "density_2d_filled",
  position = "identity",
  show.legend = NA,
  show.help = NULL,
  inherit = TRUE,
  environment = parent.frame()
)
Arguments
- object
When chaining, this holds an object produced in the earlier portions of the chain. Most users can safely ignore this argument. See details and examples.
- gformula
A formula with shape
y ~ x. Faceting can be achieved by including|in the formula.- data
The data to be displayed in this layer. There are three options:
If
NULL, the default, the data is inherited from the plot data as specified in the call toggplot().A
data.frame, or other object, will override the plot data. All objects will be fortified to produce a data frame. Seefortify()for which variables will be created.A
functionwill be called with a single argument, the plot data. The return value must be adata.frame, and will be used as the layer data. Afunctioncan be created from aformula(e.g.~ head(.x, 10)).- ...
Additional arguments. Typically these are (a) ggplot2 aesthetics to be set with
attribute = value, (b) ggplot2 aesthetics to be mapped withattribute = ~ expression, or (c) attributes of the layer as a whole, which are set withattribute = value.- alpha
Opacity (0 = invisible, 1 = opaque).
- color
A color or a formula used for mapping color.
- group
Used for grouping.
- linetype
A linetype (numeric or "dashed", "dotted", etc.) or a formula used for mapping linetype.
- linewidth
A numerical line width or a formula used for mapping linewidth.
- contour
If
TRUE, contour the results of the 2d density estimation.- n
Number of grid points in each direction.
- h
Bandwidth (vector of length two). If
NULL, estimated usingMASS::bandwidth.nrd().- lineend
Line end style (round, butt, square).
- linejoin
Line join style (round, mitre, bevel).
- linemitre
Line mitre limit (number greater than 1).
- xlab
Label for x-axis. See also
gf_labs().- ylab
Label for y-axis. See also
gf_labs().- title, subtitle, caption
Title, sub-title, and caption for the plot. See also
gf_labs().- geom, stat
Use to override the default connection between
geom_density_2d()andstat_density_2d().- position
Position adjustment, either as a string naming the adjustment (e.g.
"jitter"to useposition_jitter), or the result of a call to a position adjustment function. Use the latter if you need to change the settings of the adjustment.- show.legend
logical. Should this layer be included in the legends?
NA, the default, includes if any aesthetics are mapped.FALSEnever includes, andTRUEalways includes. It can also be a named logical vector to finely select the aesthetics to display.- show.help
If
TRUE, display some minimal help.- inherit
A logical indicating whether default attributes are inherited.
- environment
An environment in which to look for variables not found in
data.
Value
a gg object
Specifying plot attributes
Positional attributes (a.k.a, aesthetics) are specified using the formula in gformula.
Setting and mapping of additional attributes can be done through the
use of additional arguments.
Attributes can be set can be set using arguments of the form attribute = value or
mapped using arguments of the form attribute = ~ expression.
In formulas of the form A | B, B will be used to form facets using
facet_wrap() or facet_grid().
This provides an alternative to
gf_facet_wrap() and
gf_facet_grid() that is terser and may feel more familiar to users
of lattice.
Evaluation
Evaluation of the ggplot2 code occurs in the environment of gformula.
This will typically do the right thing when formulas are created on the fly, but might not
be the right thing if formulas created in one environment are used to create plots
in another.
See also
Examples
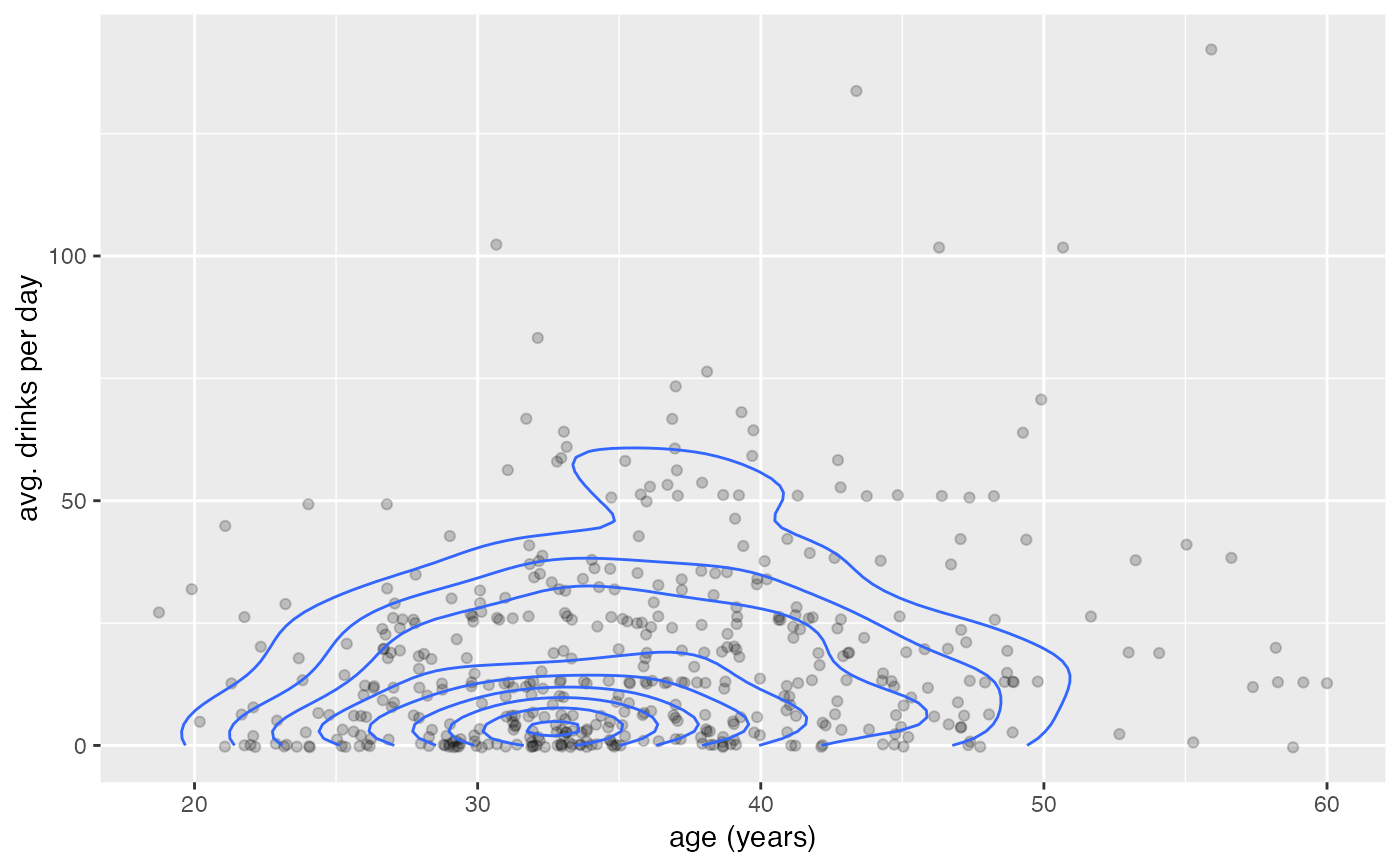
gf_jitter(avg_drinks ~ age,
alpha = 0.2, data = mosaicData::HELPrct,
width = 0.4, height = 0.4
) |>
gf_density_2d(avg_drinks ~ age, data = mosaicData::HELPrct)
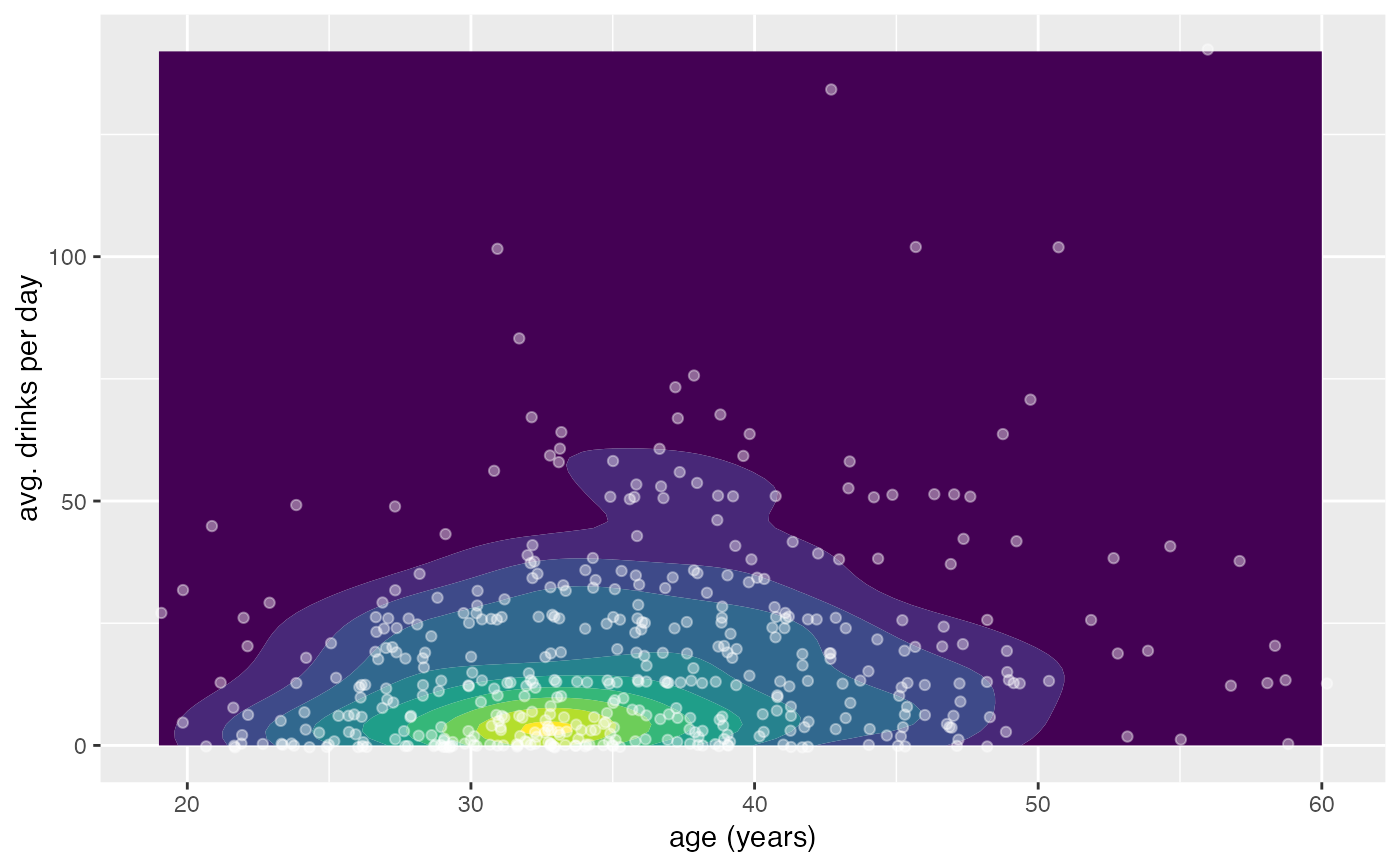
 gf_density_2d_filled(avg_drinks ~ age, data = mosaicData::HELPrct, show.legend = FALSE) |>
gf_jitter(avg_drinks ~ age,
alpha = 0.3, data = mosaicData::HELPrct,
width = 0.4, height = 0.4,
color = "white"
)
gf_density_2d_filled(avg_drinks ~ age, data = mosaicData::HELPrct, show.legend = FALSE) |>
gf_jitter(avg_drinks ~ age,
alpha = 0.3, data = mosaicData::HELPrct,
width = 0.4, height = 0.4,
color = "white"
)
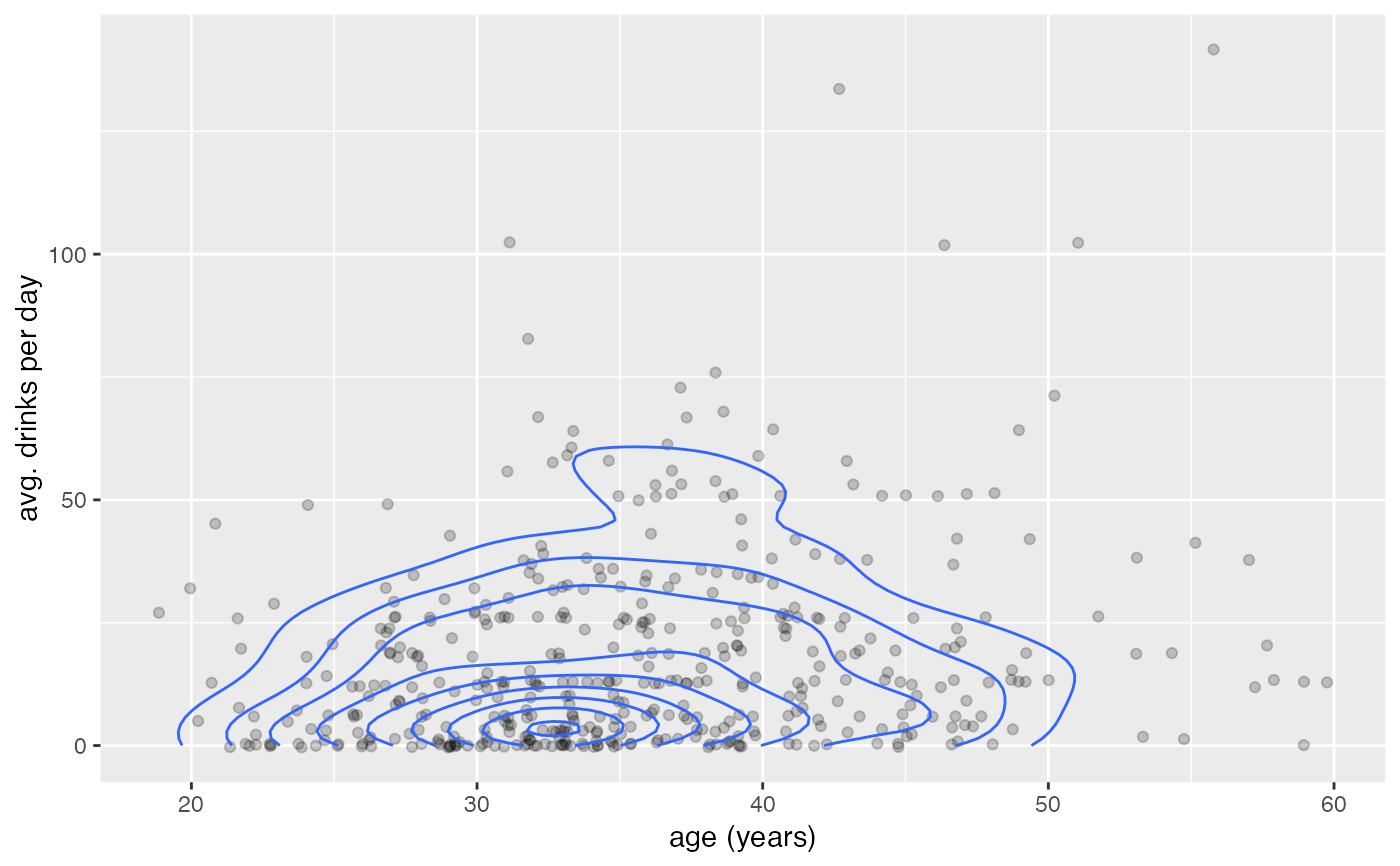
 gf_jitter(avg_drinks ~ age,
alpha = 0.2, data = mosaicData::HELPrct,
width = 0.4, height = 0.4
) |>
gf_density2d(avg_drinks ~ age, data = mosaicData::HELPrct)
gf_jitter(avg_drinks ~ age,
alpha = 0.2, data = mosaicData::HELPrct,
width = 0.4, height = 0.4
) |>
gf_density2d(avg_drinks ~ age, data = mosaicData::HELPrct)
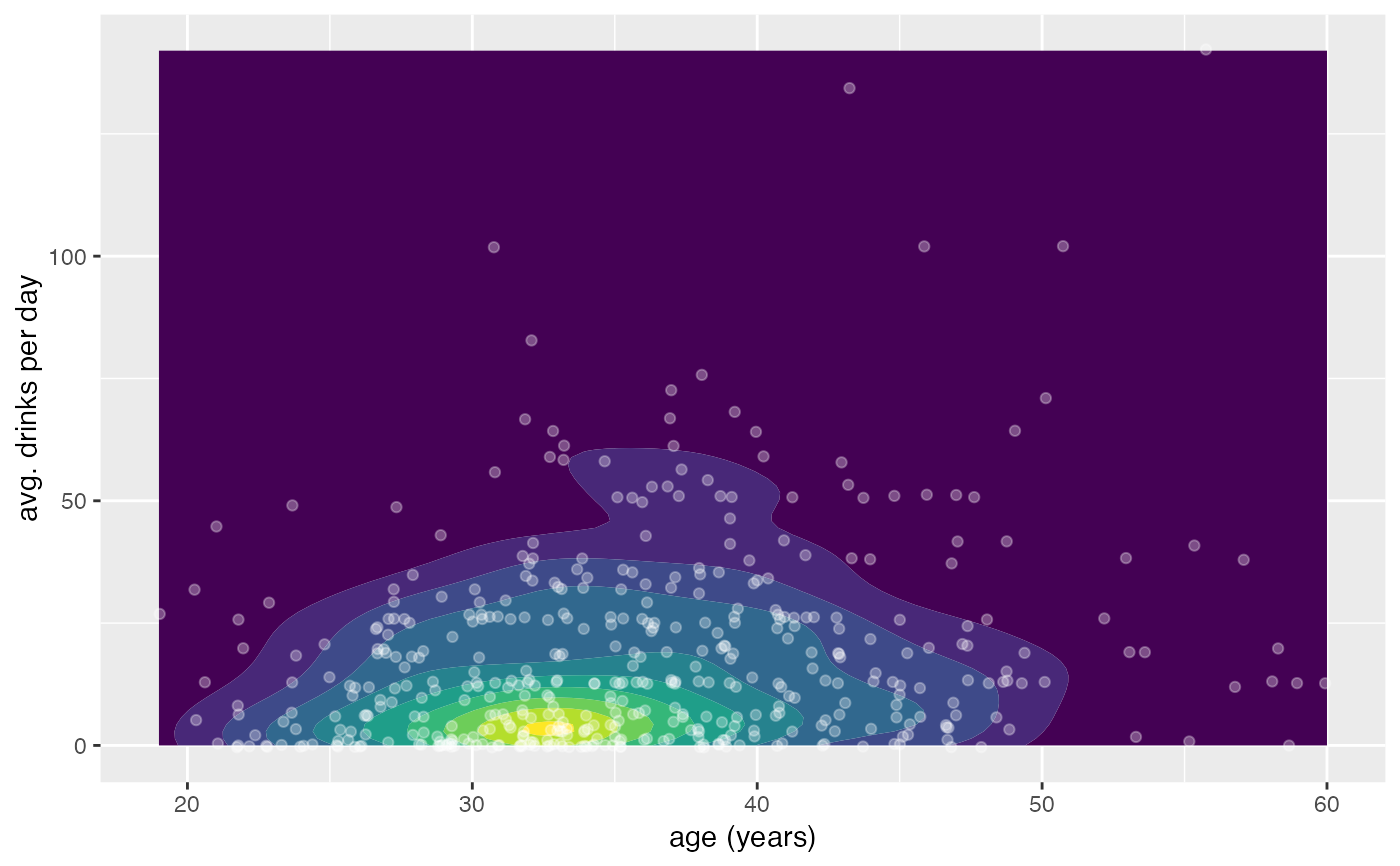
 gf_density2d_filled(avg_drinks ~ age, data = mosaicData::HELPrct, show.legend = FALSE) |>
gf_jitter(avg_drinks ~ age,
alpha = 0.4, data = mosaicData::HELPrct,
width = 0.4, height = 0.4,
color = "white"
)
gf_density2d_filled(avg_drinks ~ age, data = mosaicData::HELPrct, show.legend = FALSE) |>
gf_jitter(avg_drinks ~ age,
alpha = 0.4, data = mosaicData::HELPrct,
width = 0.4, height = 0.4,
color = "white"
)